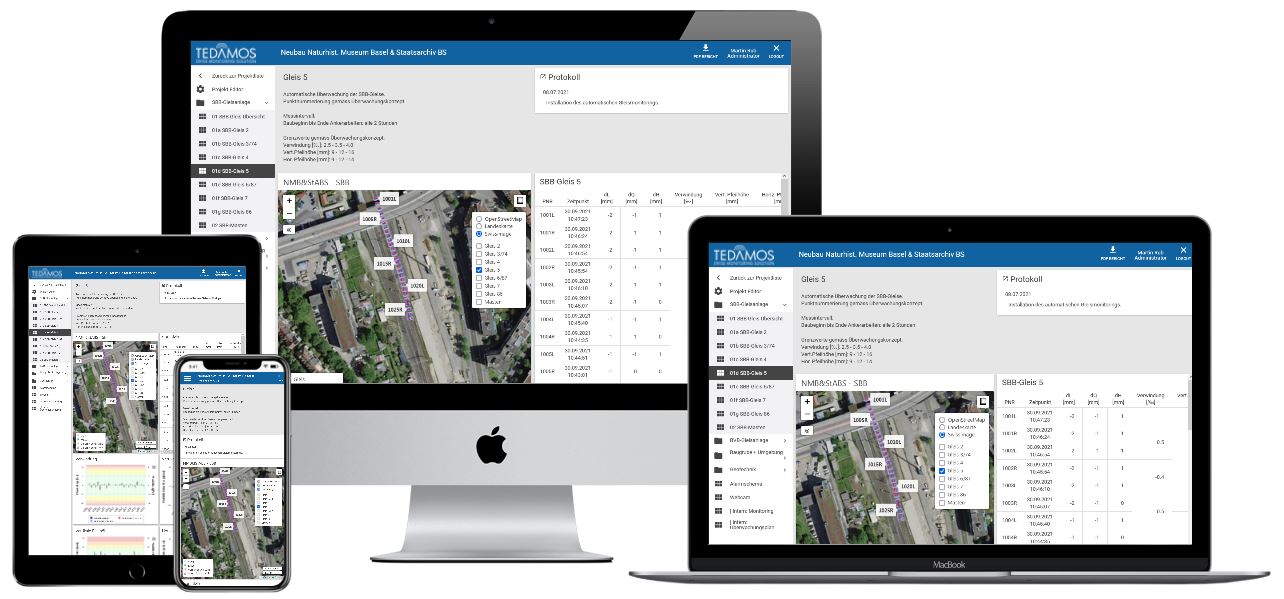
TEDAMOS Web Portal | Real-Time Monitoring Data
The TEDAMOS Web Portal provides a clear and centralised view of all project-related monitoring data. Live measurements, maps, images and analyses are available in one place, making trends, changes and threshold exceedances immediately visible. This enables faster, well-informed decisions based on reliable, up-to-date information.
Secure, password-protected access ensures clear project organisation and controlled data sharing. Projects are managed separately, while flexible user permissions give every stakeholder access to the information they need.
As a browser-based and fully responsive application, the TEDAMOS Web Portal works seamlessly on desktops, tablets and smartphones – without requiring any software installation.
Key Features

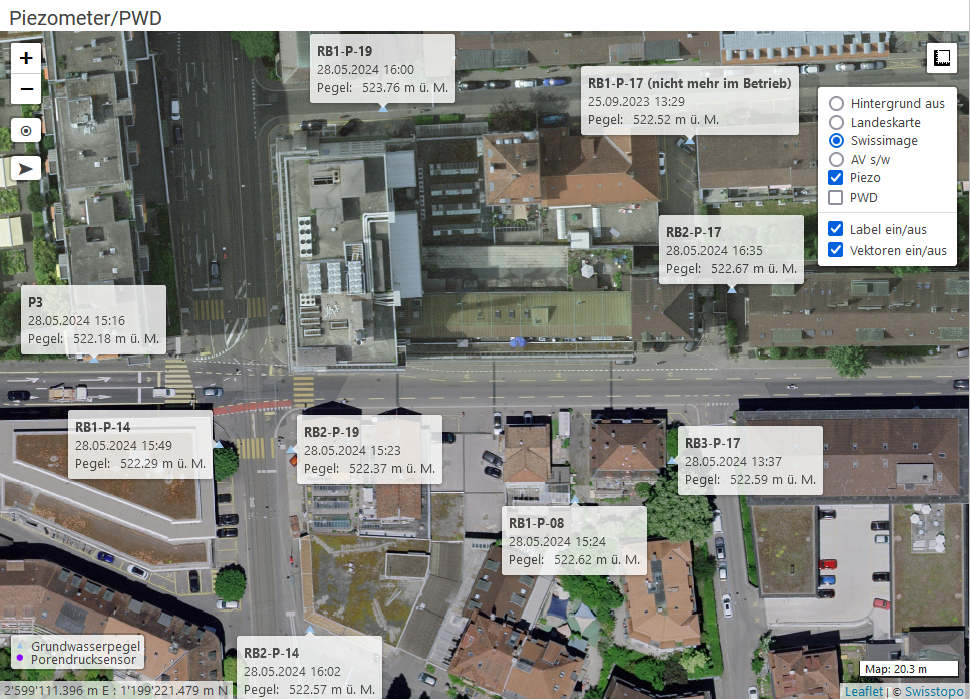
Layer Structure
Organise maps using configurable layers for base maps and measurement data. Show or hide individual layers to focus on the information you need.

Measurement Functions
Measure coordinates, distances and areas directly within the map. Based on absolute coordinates, all map content is displayed accurately and to scale.
Initial Configuration
Configure the initial view to display the most relevant project information. Depending on the project, this may include the latest measurements, point labels, displacement vectors or system status.
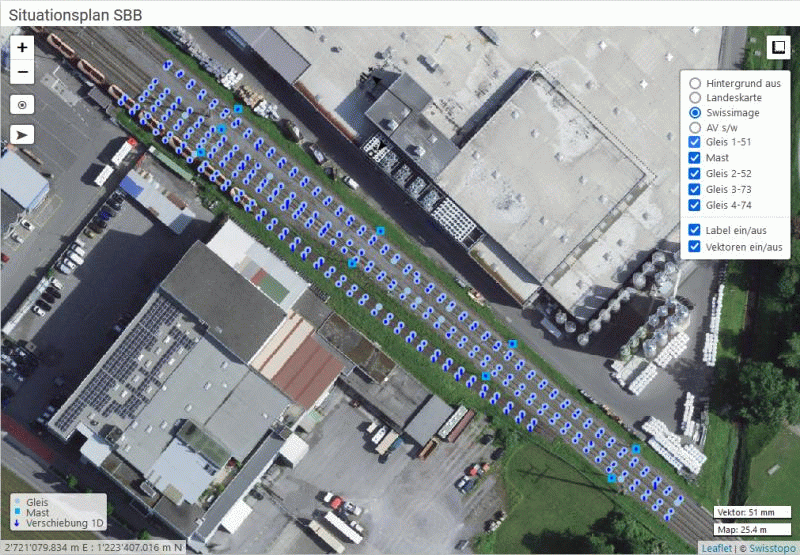
Background Maps
Display orthophotos, cadastral maps, WMS services and CAD plans as configurable background maps. Switch between available base maps at any time via the legend.
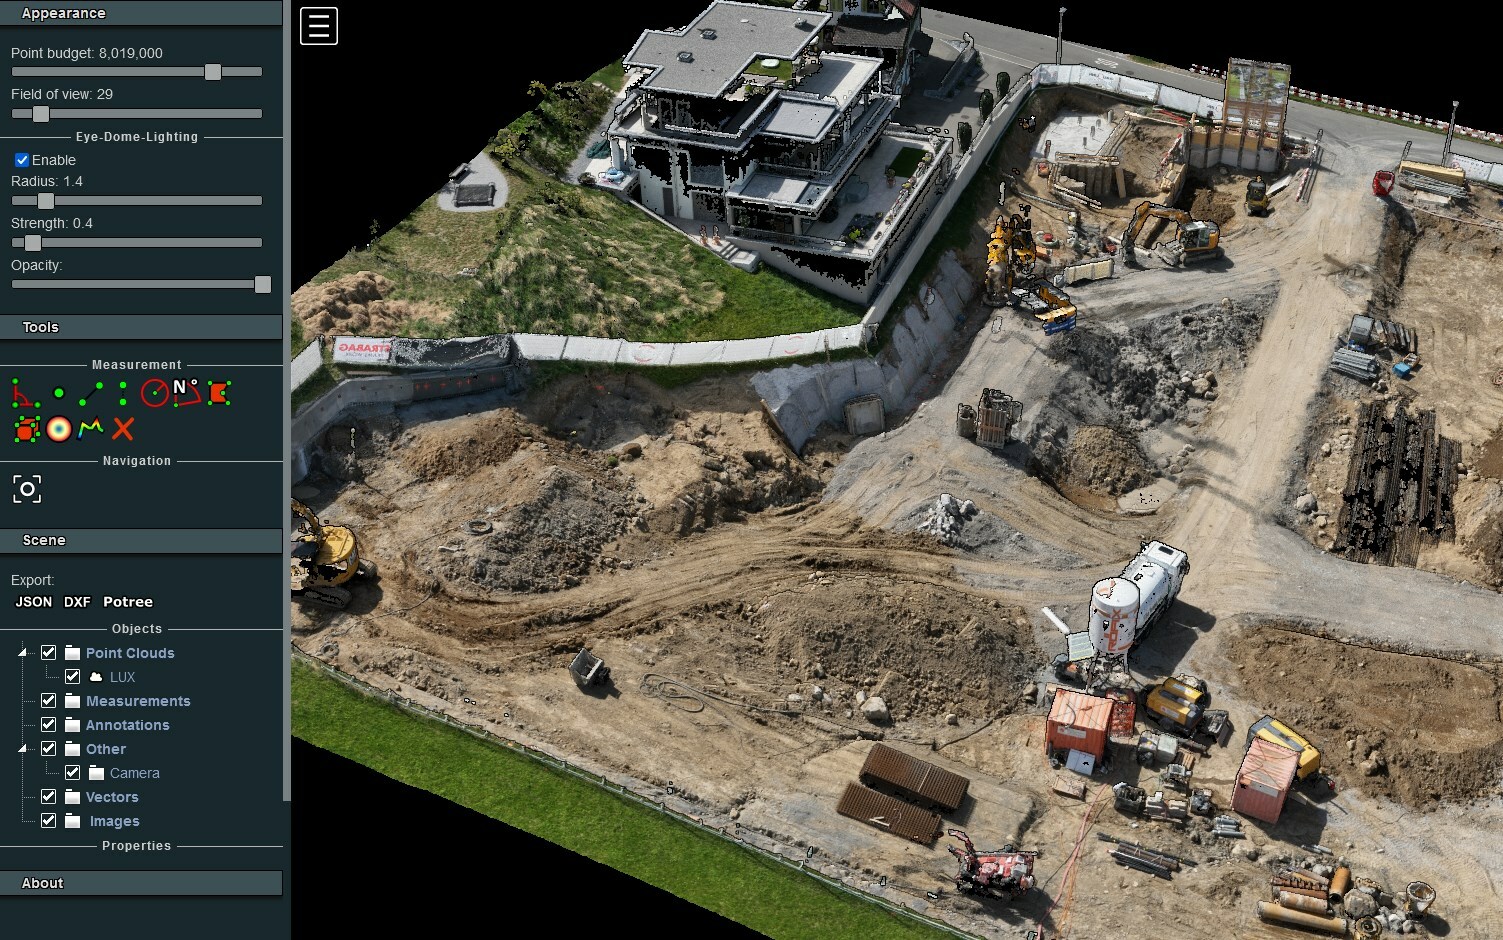
3D Viewer
Explore high-resolution terrain models interactively in the integrated 3D Viewer. Analyse the project area from every perspective.
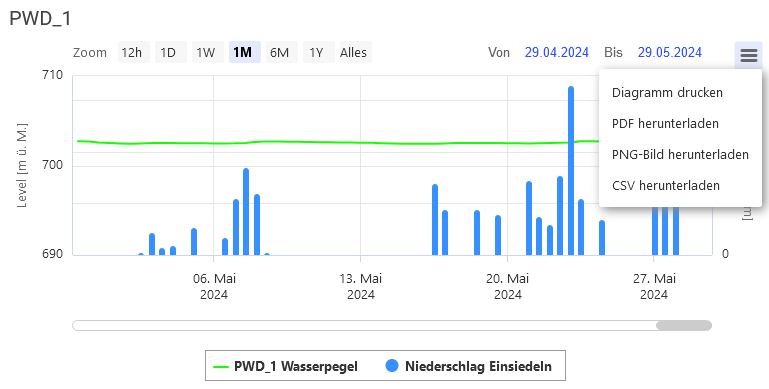
Further Processing
Print diagrams directly or export them as PDF or PNG files. Download measurement data in CSV format for further analysis and reporting.
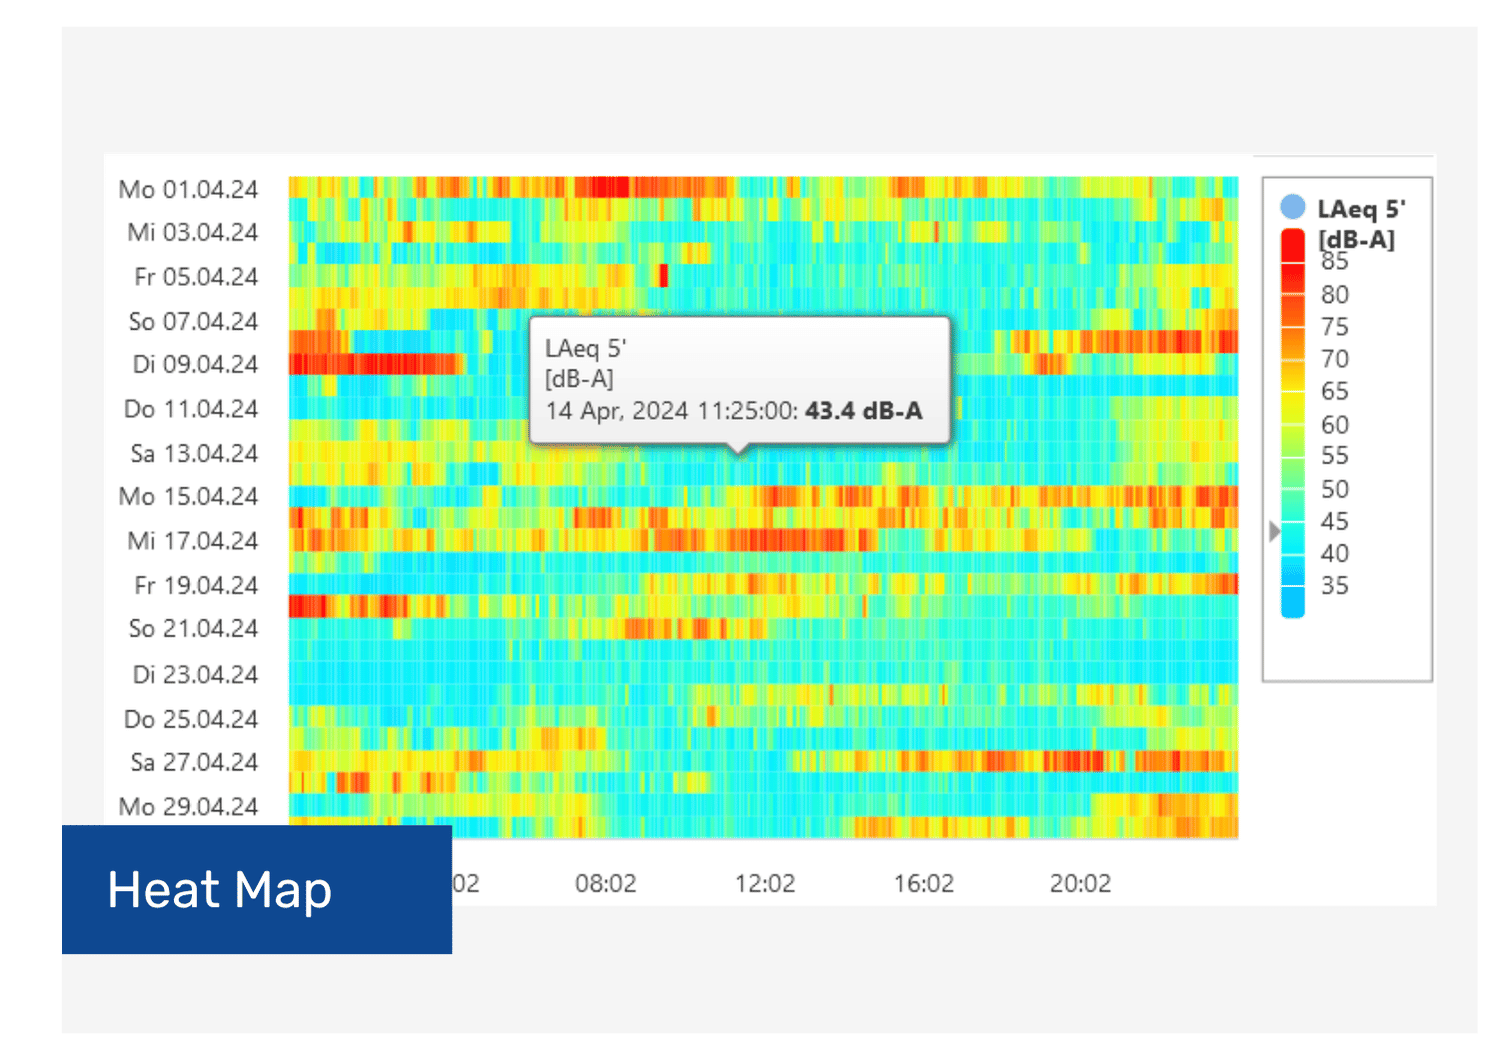
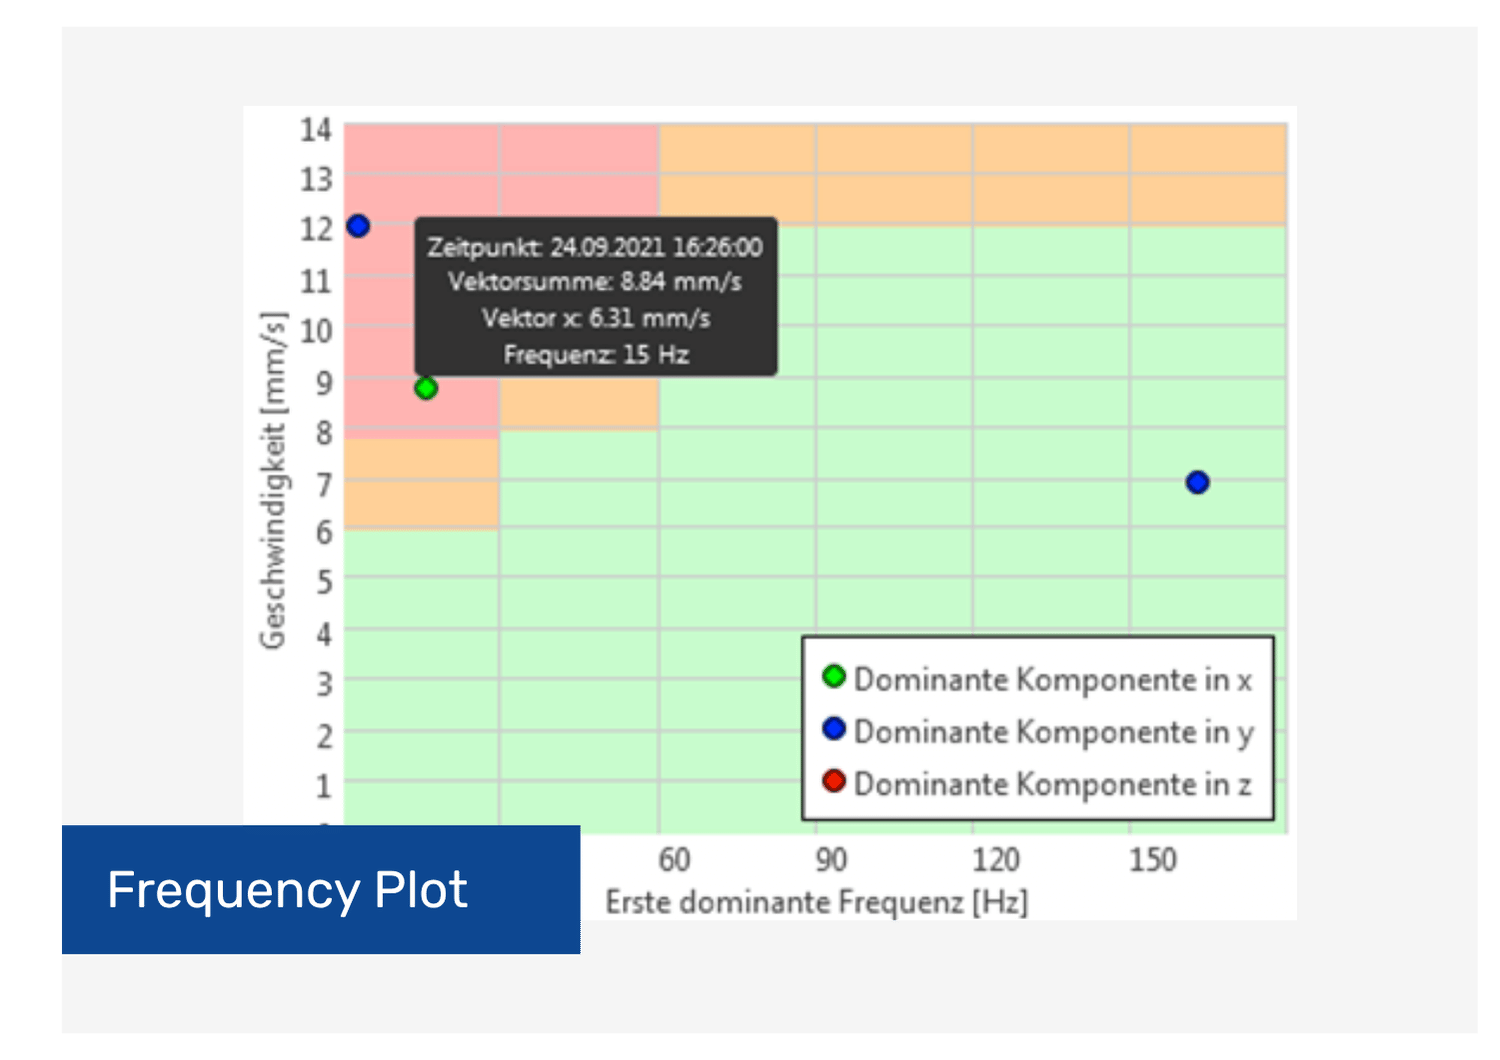
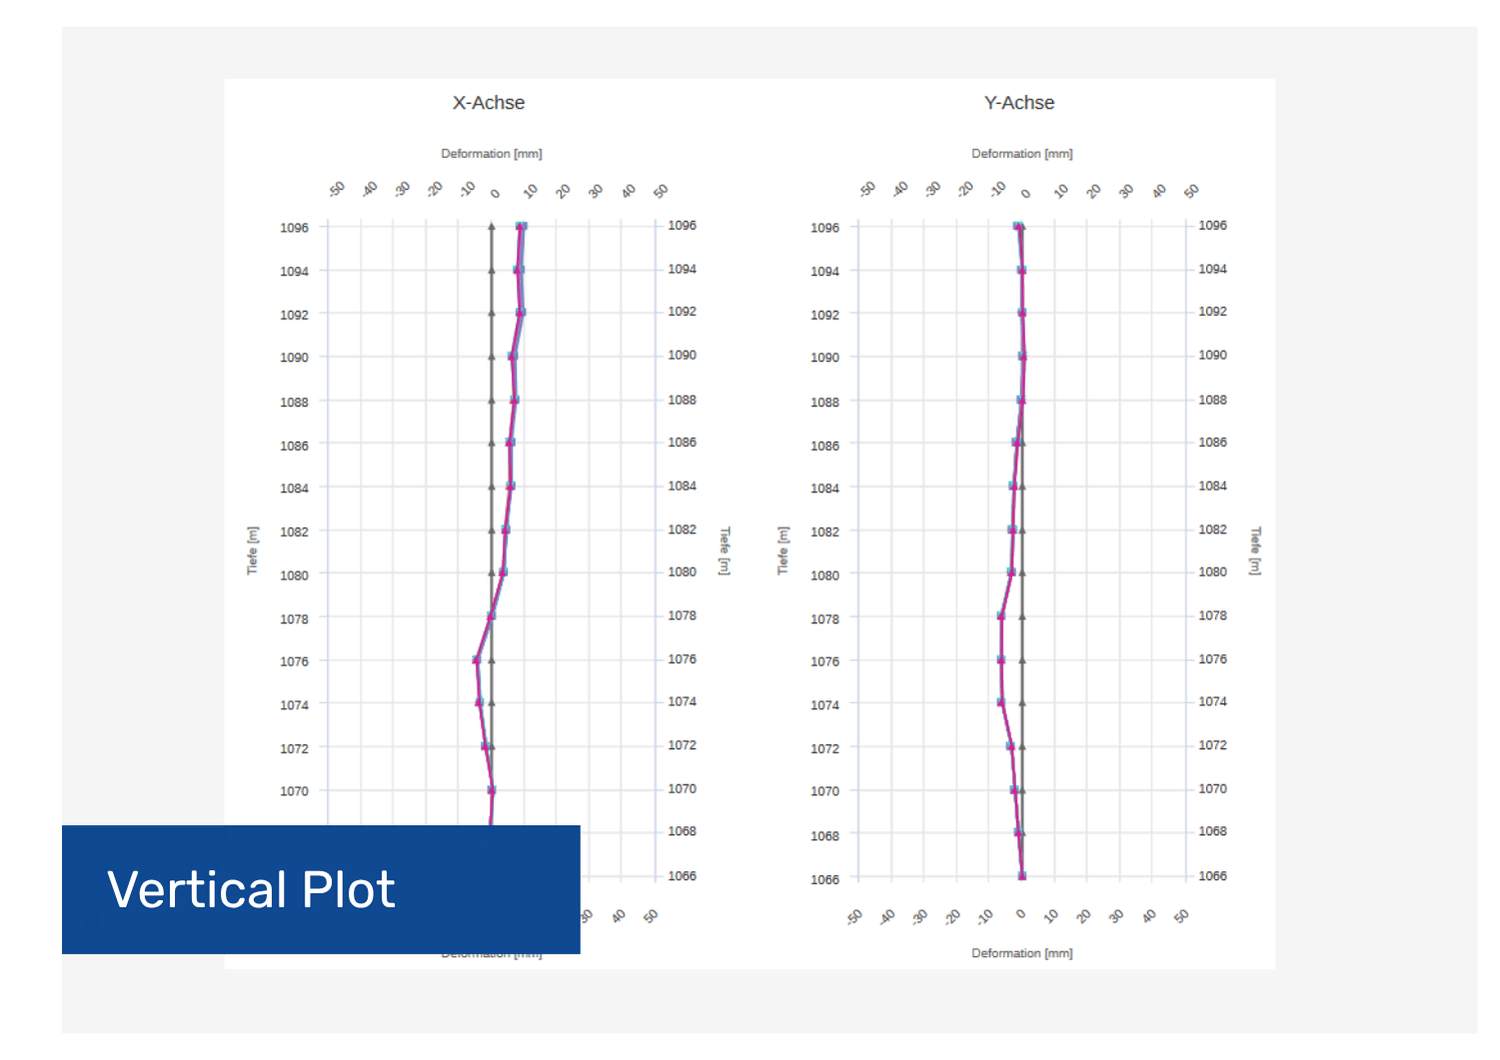
Visualisation & Analysis
Alerting
TEDAMOS supports flexible alerting via email, SMS, phone calls, as well as audible and visual warning systems. Multi-level thresholds, recipient groups and escalation workflows can be configured individually for each monitoring point.
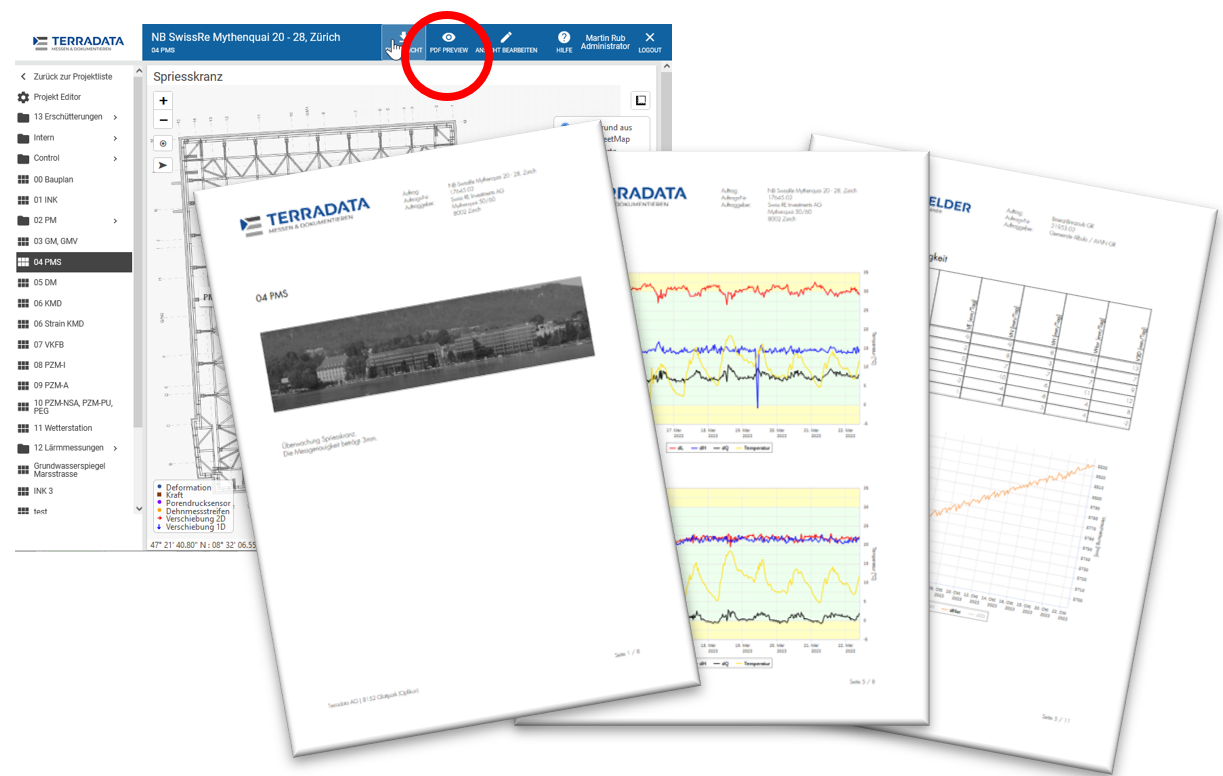
PDF Report Generation
Generate professional reports automatically on a daily or weekly basis, or create up-to-date reports on demand with a single click. Reports can be exported as PDF and shared with project stakeholders.
API Interface for Third-Party Data
Connect TEDAMOS with external databases and applications through a fully documented API. Export monitoring data or integrate third-party data seamlessly using standardised API endpoints.